
2024 - 2025 (+/- 1)
Current projects
I devote my down time to a rotation of these 4 projects to improve my skills in data, design, development, and decision-making.
Checkout the demos, let me know what you think. I’m always looking for feedback and complaints!

Tech stack & highlights: React, Three.js, Next.js, Vercel, OrbitControls, Dynamic Data Fetching, & State management. Github here.
A novel way to consume news and introduce new possibilities for understanding the complex, interconnected nature of current events and information cycles in our globalized world.
-
I've always wanted to make something with three.js and dynamic data fetching but didn't want it to be too complicated, so I settled on RSS news feeds as a starting point for 3-dimensional news network graph.
-
Interactive 3D Visualization
Time and category filtering and text search
Settings panel to add and remove different RSS feeds.
Auto-rotation for ever-changing perspective on news cycles
-
Since it's a novel way to consumer news that can also be categorized as a novelty, ensuring intuitive navigation in an unfamiliar space is crucial. Balancing the presentation of comprehensive data with the need for a clear, uncluttered visualization also a key point.
-
There's a lot to improve in this version, starting with:
Filter and settings bugs
3D interaction
Relationship mapping
going from RSS feeds to APIs
Going from Javascript to Typescript

Tech stack & highlights: React, Typescript, Next.js, Vercel, Beautiful Soup, Python, OpenAI API, TMDb API. Github here.
An exploration of disaster movies over time to unveil societal anxieties and cultural shifts through the lens of Hollywood's catastrophic narratives + versatile template for visualizing data on decade-by-decade basis.
-
I love disaster movies and wanted to make a single place that scraped all the fragmented internet lists of relevant films. Beyond the aggregation, categorization of disaster types was essential. As I evolved the design from yearly to decade, I realized that the project can double as a template for other data sources.
-
Data collection & processing: custom scrapers and OpenAI API integration for summaries and categorization
Interactive Visualization: display detailed information for each film
Filtering & search: based on isaster type, year range, and text search
-
Category coding and temporal representation posed the biggest challenges in this project. Switching from a century-long timeline to decade-based visualization significantly improved UI clarity and user experience. This shift allowed for better pattern recognition across eras. While functional, the search and filter features still need refinement to fully leverage the dataset's potential. This project highlights how thoughtful data organization can transform raw information into accessible insights, with applications beyond just disaster movies.
-
Filter and settings bugs (again)
NLP techniques for more accurate disaster type categorization and theme extraction
Comparative Analysis Tools that compare more datapoints from the movies
Create a public API for the disaster movie dataset
Template generalization to easily adapt to other types of decade-based data visualization projects
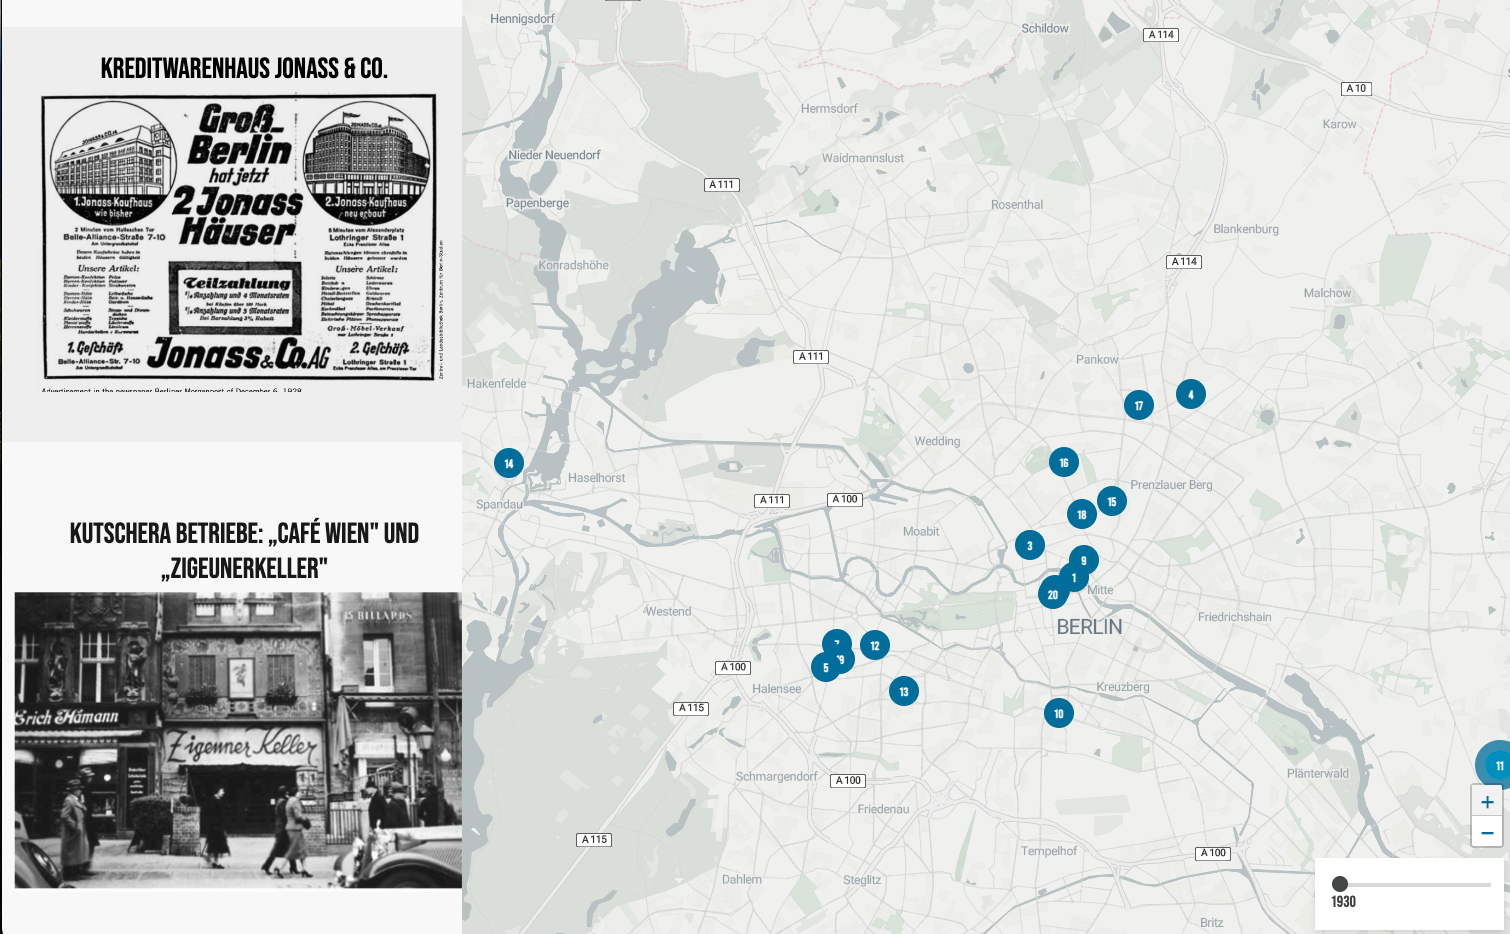
Jewish Berlin Revisited: A Memorial Map to Pre-1945 Cultural Heritage
Tech stack & highlights: JQuery, leaflet, Github here.
This project illuminates the rich tapestry of Jewish life in Berlin before World War II, showcasing the integral role Jewish citizens played in the city's economic, cultural, and social fabric.
-
Inspired by the Stolpersteine (stumbling stones) project in Germany, which commemorates victims of Nazi persecution, I set out to create a digital map honoring Jewish businesses and their contributions to local communities. For the MVP, I built upon leaflet-storymaps functionality and then want to improve upon it by making a react platform for location-based storytelling.
-
Interactive map with pinpointed locations of historic Jewish businesses
Detailed information on side panel
Time slider to show takeovers and closures
Googlesheets customization template for general use
-
While this UI/UX works for a limited number of entries, adding all 10,000+ points requires filtering, clustering, and summarization. Contextual storytelling and guided exploration became my North Stars for this project.
-
There's a lot to improve in this version, starting with:
Filter and settings bugs
3D interaction
Relationship mapping
going from RSS feeds to APIs
Going from Javascript to Typescript

Tech stack & highlights: Typescript, React, Googlemaps API, Anthropic API but that’s private. Github for MVP here.
Recommendation engine that combines agricultural economics and nature-based carbon-negative solutions so farmers can better profit from climate change (by helping the planet)!
-
In graduate school, I learned about the power of soil to sink in tons of CO2, the benefits of insects, and the copious data we have on the planet to inform better farming practices. So I set out to use AI to cull specialized knowledge for carbon-farming that also can identify best economic opportunities in specific regions.
-
Geocoding from address and satellite image generation
Crop and insect interaction database
Anthropic AI integrated recommendations
-
The data input required to get accurate AI insights could be tedious without a sound strategy. After building the MVP, I realized that introducing a pre-populated template that demonstrates the application's ability is a promising path to take for a prime UX.
-
Current version is not particularly userful, to get it to a true MVP, I need to:
Aggregate necessary information about sustainable practices, local climate/economics, and ecology
Build out a training model
Have efficiency index